Phase Diagram
Phase diagrams are graphical representations of the states at which substances exist under a certain temperature and pressure.
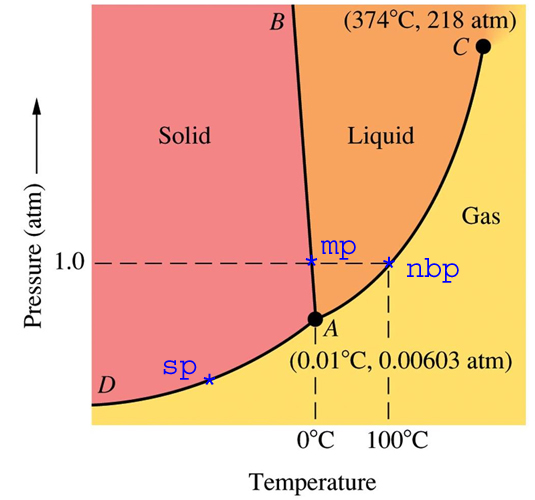
This is a Phase Diagram for water. The points labeled mp and nbp represent the normal melting point and the normal boiling point, respectively. These are the temperatures at which water melts at 1 atmosphere of pressure (0C) and where water boils at 1 atm (100C). If you look closely, you'll notice that past point C, the yellow and orange colors mix together. Point C is known as the critical point for any substance. There is a critical temperature and a critical pressure. For this particular substance, the critical temperature is 374 degrees Celsius and the critical pressure is 218 atm. This is known as the critical point because past this point on the chart, it is not possible to distinguish between a liquid and a gas. This state of mater is known as a supercritical liquid. Point A is known as the triple point. At the triple point, all three states exist in equilibrium. The line segment and the two curves represent the circumstances, with respect to pressure and temperature, for which the substance changes phases. For example, the substance changes from a solid to a gas (sublimation) at any point along the curve DA.
This is a Phase Diagram for water. The points labeled mp and nbp represent the normal melting point and the normal boiling point, respectively. These are the temperatures at which water melts at 1 atmosphere of pressure (0C) and where water boils at 1 atm (100C). If you look closely, you'll notice that past point C, the yellow and orange colors mix together. Point C is known as the critical point for any substance. There is a critical temperature and a critical pressure. For this particular substance, the critical temperature is 374 degrees Celsius and the critical pressure is 218 atm. This is known as the critical point because past this point on the chart, it is not possible to distinguish between a liquid and a gas. This state of mater is known as a supercritical liquid. Point A is known as the triple point. At the triple point, all three states exist in equilibrium. The line segment and the two curves represent the circumstances, with respect to pressure and temperature, for which the substance changes phases. For example, the substance changes from a solid to a gas (sublimation) at any point along the curve DA.
(Phase diagram for water)
